
Lakemba Ramadan Nights: Urban Growth vs. Livability
SydneyAU
A Sample Case Study Demonstrating the CityPulse TriAxis™ Urban Event Assessment Framework.
How did a local food festival scale into one of Australia’s largest cultural activations with 1.57 million annual visitors? Discover how CityPulse evaluates the critical balance between rapid economic growth and urban infrastructure strain using our TriAxis™ Approach.
This sample report demonstrates the structure, tone, and analytical approach used in real CityPulse Analytics projects.
Key Metrics Dashboard
1.57M
Annual Visitors
A 500%+ increase since 2019
$50M
Night-Time Economy Injection
73.3%
Private Vehicle Reliance
-41%
Local Income Deficit
We look past surface-level crowd numbers to analyze major urban events across three deeply interconnected realities
PHYSICAL LAYER
Assessing transit capacities, local traffic bottlenecks, and infrastructure elasticity under extreme demand.
ECONOMIC LAYER
Evaluating vendor performance, consumer spending patterns, and wealth distribution between temporary stalls and permanent local retailers.
SOCIAL LAYER
Measuring cultural stewardship, local resident sentiment, and tracking public discourse at a national scale.
Interactive Insights
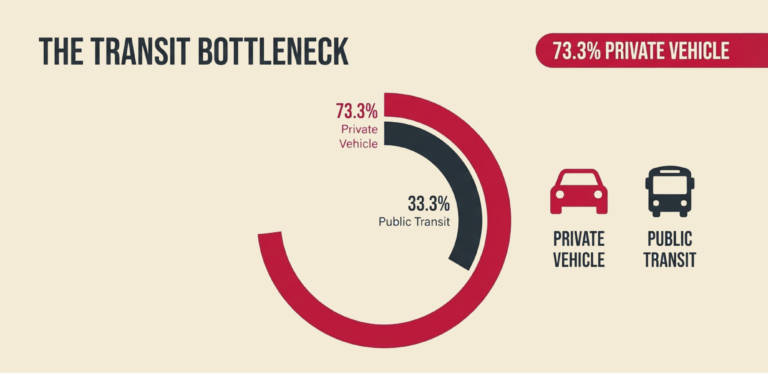
Severe private vehicle dependence pushes residential streets past their elastic capacity, creating friction between event growth and resident livability.
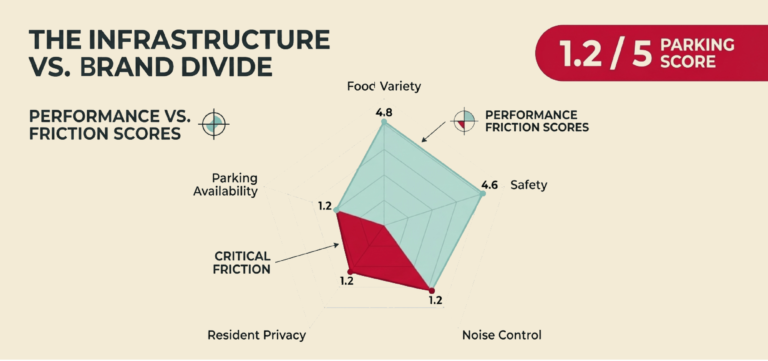
Cultural brand success (Food Variety: 4.8) is heavily outstripping physical infrastructure capabilities (Parking Accessibility: -1.2).
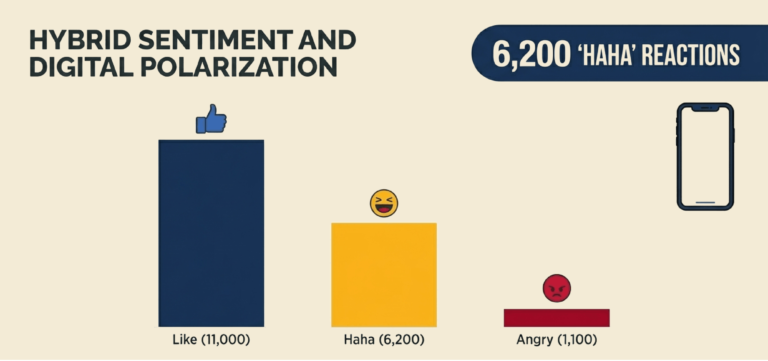
Tracking how a localized cultural market scales into a proxy for national identity and social license debates online.
Strategic Directive
Short-Term
Traffic exclusion zones, pedestrian flow optimization, and high-frequency waste routing

Mid-Term
Event footprint expansion and localized economic impact testing
Long-Term
Coordinated integration into Sydney’s overarching Night-Time Economy (NTE) policy framework
Is this an official or commissioned report?
No. This is an independent sample strategic analysis developed by CityPulse Analytics. It is not officially commissioned by, endorsed by, or affiliated with any government agency or local council.
What is the purpose of this case study?
This page serves as a functional demonstration of our proprietary TriAxis™ Framework. It showcases how CityPulse evaluates the complex interplay between rapid urban growth, economic activity, and community infrastructure during major metropolitan events.
Our Approach
The insights are built upon our TriAxis™ Approach, which triangulates public community datasets (2024–2025), metropolitan-scale digital sentiment tracking, and independent qualitative field observations. No active live surveys are conducted on this page.
Data Provenance: This assessment is built upon the triangulation of high-fidelity community reporting (2024–2025), metropolitan-scale digital discourse tracking, and qualitative field observations conducted by CityPulse Analytics.
Sample Project Disclaimer: This webpage serves exclusively as an illustrative scenario to demonstrate the analytical capabilities, research rigor, and structural formatting of the CityPulse TriAxis™ framework. No real-world user data is collected on this page, and this independent research is not commissioned by or officially affiliated with any government agency or project authority.